Viewing Production Graphs
View production graphs using the Prod Graph tab of the DataCard in which the desired well, gas plant, battery, or field is displayed. For graphs where dates run along the X axis, a Years check box appears at the top of the Well Production Graph pane that you can click and then specify the From and To years for which to show data. The particular XY coordinates for a given stream can be inspected. When inspecting XY coordinates along a stream, data points that fall outside of the axis extents are ignored.
To view production data summarized for several wells, with the wells selected in the Data Navigator pane, click Group Wells ( ) in the DataCard ribbon.
To view production graphs
- With a DataCard for the desired item displayed, click the Prod Graph tab.
To display cumulative production for multiple wells, select the wells in the Data Navigator pane, and then click Group Wells ().
The tab appears.
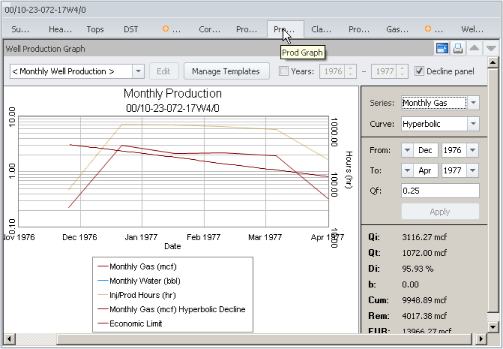
- Select one of the stock graph templates with which to display production data from the Template drop-down list. To create a new graph template or modify an existing template, see Related Topics below.
- With the desired graph displayed, select from the following functionality:
- Enable the Years check box and then specify the range over which to display data by typing in or clicking the From To controls. Unless the Years check box is cleared, the range specified above is used when viewing production data for other items in the current data type (wells, gas plants, or batteries) for this and future AccuMap sessions.
- To view XY values along a production stream, either hover your cursor over a given point, click the desired stream, or right-click the Prod Graph display pane and from the context menu, select Inspect Data Points. A marker (
 ) appears on the stream. Move the marker by either pressing the LEFT or RIGHT arrow keys on your keyboard, or by moving your mouse. As the marker moves along the stream, XY values appear in a tooltip alongside the marker and the particular point along the stream for which XY values are displayed is highlighted yellow.
To switch streams, either click the desired stream or press the UP or DOWN arrow keys. To end stream inspection mode, either click the currently selected stream a second time, or right-click the Prod Graph display pane and from the context menu, select Exit Inspect Mode.
Because both the mouse and the keyboard can be used to move the marker along the stream, when the cursor is hovered over the Prod Graph display pane, it may interfere with the ability to move the marker using the LEFT and RIGHT arrow keys. To prevent this problem, don't hover the cursor over the graph if you want to inspect a stream using the arrow keys on the keyboard.
- Right-click the graph and from the context menu, select whether to save the image in raster format, or save it to the Windows Clipboard so that it can be pasted into another application.
- Complete a decline analysis. For details, see Related Topics below.
 Related Topics